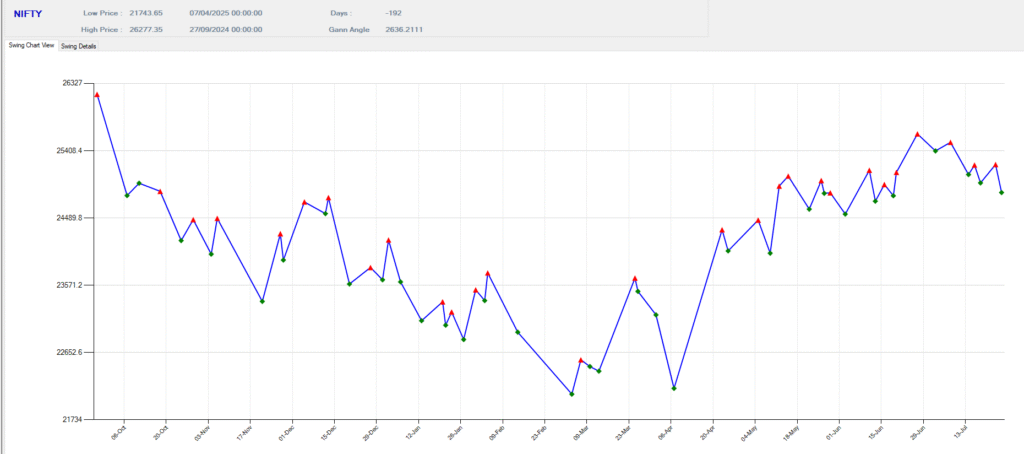
This chart represents the swing chart view of the NIFTY index, showing price swings between highs and lows from September 2024 to July 2025. Here’s a detailed breakdown and analysis:
🔍 Key Information (Top Section)
Parameter
Value
High Price
26,277.35 on 27/09/2024
Low Price
21,743.65 on 07/04/2025
Gann Angle
2636.2111
Duration
-192 days (appears to be a reversed timeframe, possibly a data input or plotting error)
📉 Trend Analysis
1. Initial Downtrend (Late Sep 2024 – Early April 2025)
The NIFTY started declining after hitting a peak of 26,277.35 in late September 2024.
The index continued to make lower highs and lower lows, bottoming at 21,743.65 in early April 2025.
This represents a correction of about 17% from the top.
Bearish swings dominate this phase (red triangles for tops are more frequent and trending lower).
2. Reversal & Uptrend (Mid-April 2025 – July 2025)
After reaching its low in April, the index shows a sharp reversal.
A series of higher highs and higher lows emerges, indicating bullish momentum.
The swings are smaller compared to the earlier decline, but more consistent.
The price steadily climbs back toward the 24,800 – 25,400 range by July 2025.
📈 Technical Observations
Swing Points:
Red triangles = Swing highs (resistance points)
Green diamonds = Swing lows (support points)
Gann Angle:
The Gann angle value of 2636.21 might be used for time-price correlation, possibly indicating key support/resistance or timing zones.
📈 Trend Observations (From Sept 2024 to July 2025)
🔻 Major Downswings (Bearish Moves):
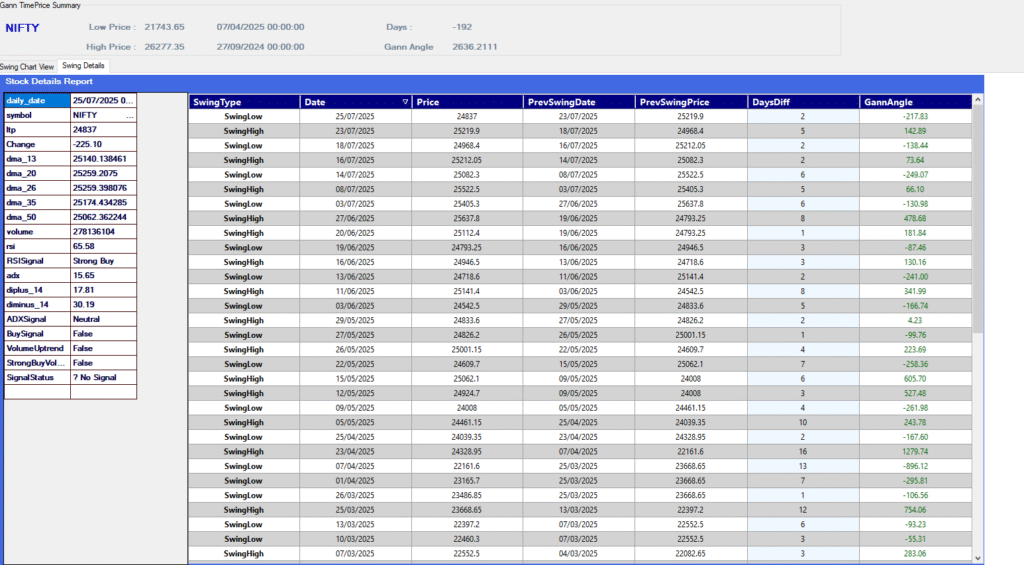
04 Mar 2025 to 04 Feb 2025: ➤ Drop of -985.17 points in 28 days ➤ Likely a strong correction phase or trend reversal.
11 Oct 2024 to 07 Oct 2024: ➤ -779.84 points in just 10 days ➤ High volatility drop.
20 Dec 2024 to 13 Dec 2024: ➤ -683.51 points in 7 days
07 Apr 2025 to 25 Mar 2025: ➤ -896.12 points in 13 days ➤ Strongest drop in recent data.
🔺 Major Upswings (Bullish Moves):
23 Apr 2025 (Swing High): ➤ From 22161.6 (07 Apr) to 24328.95 — +1279.74 points in 16 days ➤ Very strong bounce.
15 May 2025: ➤ From 24008 to 25062.1 — +605.70 points in 6 days
27 June 2025: ➤ From 24793.25 to 25637.8 — +478.68 points in 8 days
05 Dec 2024: ➤ From 23914.15 to 24708.4 — +458.47 points in 7 days
🔄 Cycle / Swing Patterns Noted:
Time Frame
Bullish Swings
Bearish Swings
Oct – Dec 2024
Mostly Bearish
Strong downtrends, heavy selling pressure
Jan – Feb 2025
Mixed
Sideways with small swings
Mar – Apr 2025
Big Swings
Sharp down followed by sharp recovery
May – July 2025
Gradual Uptrend
Healthy swing highs and lows
📌 Key Insights:
Volatility is High: Multiple 500–900 point swings in both directions indicate strong market movement.
Swing Durations:
Many strong moves (both up and down) happen in short durations (1–6 days).
This is favorable for swing traders and short-term technical analysts.
Recent Trend (July 2025):
25 July 2025 Swing Low = 24837
Previous Swing High = 25219.9 on 23 July
➤ Market dropped around -217.83 points, indicating a pullback but still within an uptrend channel.
Important Support Zone:
Repeated bounce near 24000–24500 suggests strong support.
Resistance Zone:
Market struggled around 25600–26100, forming highs but failing to sustain.
🔮 Possible Outlook (based on recent patterns):
If market breaks above 25220–25600, it can try retesting 26178.95 (Sept 2024 high).
If it drops below 24800 with volume, watch for 24400–24000 retest.
Watch for a potential higher low near 24800 — this could signal bullish continuation.
🧠 Insights
Volatility: Noticeable during the downtrend, less so during the uptrend.
Trend Shift: A clear V-shaped recovery around early April 2025.
Resistance Zone: Around 25,400 – 25,800, based on recent swing highs in July.
Support Zone: Around 23,500 – 24,000, where multiple swing lows occurred in May–June.